
Observability Stack for Kubernetes with Open Source Solutions

Keeping your Kubernetes cluster running smoothly requires constant monitoring. From that pot, this article dives into Prometheus(metrics scrapping, storing, retrieval) & Grafana (Visualisation, Alerts) two open-source tools that help Site Reliability Engineers (SREs) see what's happening inside their clusters.
Understanding Observability in Kubernetes
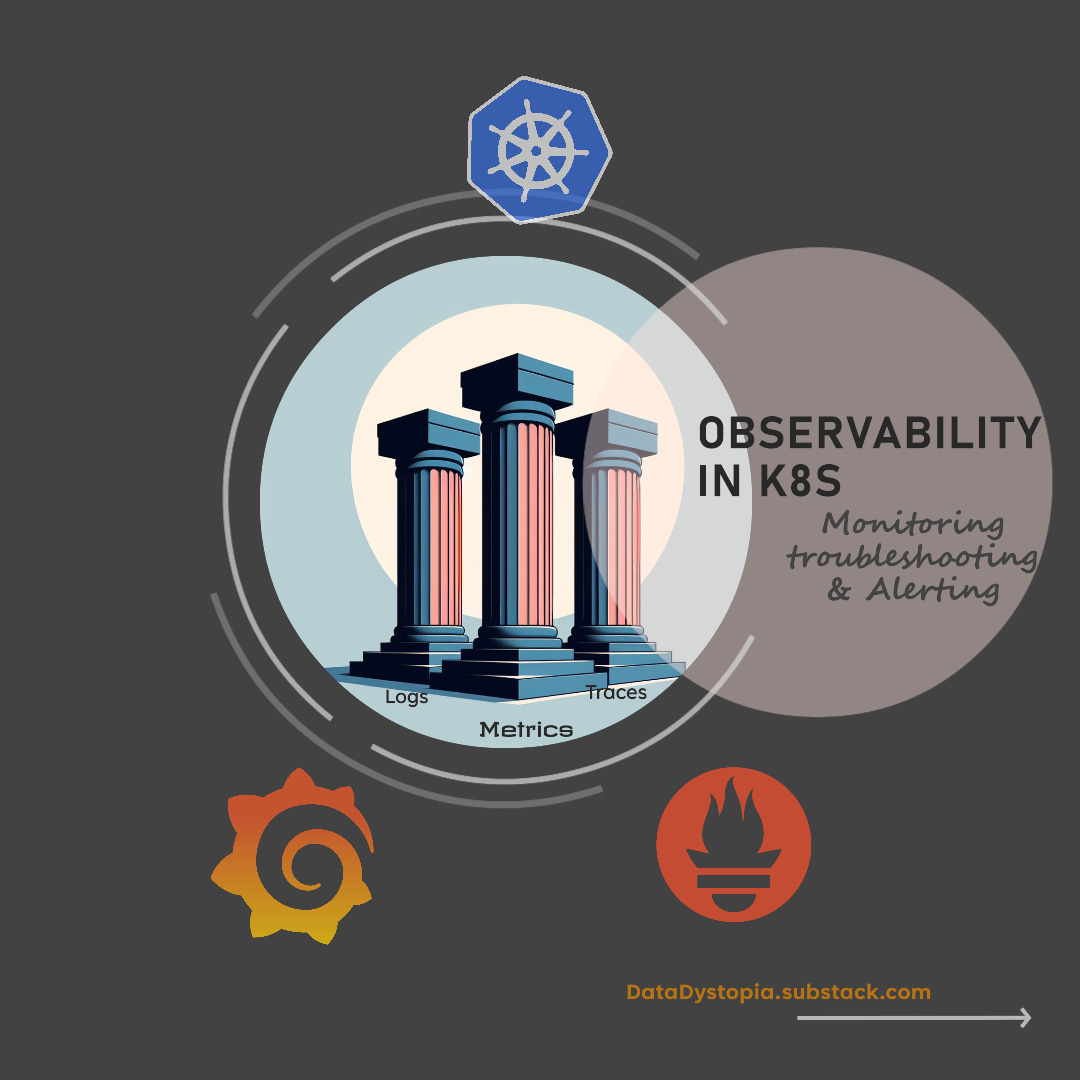
Monitoring is just one piece of the puzzle. Observability is the bigger picture, allowing you to understand how your applications are performing. It involves three key elements/pillars (as often quoted):
Metrics: Numbers that tell you how things are running, like CPU usage, memory consumption, and how long requests take. Prometheus is a great tool for collecting these metrics in Kubernetes.
Logs: Messages your applications generate that provide more details about what's happening. Logs can help you understand why metrics might be abnormal.
Traces: Information about how a request travels through your system, helping you pinpoint the exact source of problems.
By looking at all three of these elements together, SREs can get a complete picture of their Kubernetes environment and identify issues before they become major problems.
Why Use Prometheus for Kubernetes?
Prometheus acts like a central hub for collecting and storing metrics from your Kubernetes cluster. It works well with Kubernetes because it can automatically find and collect data (via exporters) from your pods and services through a mechanism called service discovery (https://www.densify.com/kubernetes-autoscaling/kubernetes-service-discovery/). This eliminates the need for manual configuration for most deployments. You can even define custom metrics (that actually makes sense to measure & monitor) to get even more insights into how your applications are running. Plus, Prometheus can send alerts if key metrics go above or below certain levels, allowing you to proactively address potential issues (https://prometheus.io/docs/prometheus/latest/configuration/alerting_rules/).
Use-Case: Imagine CPU usage for one of the micro-service in your flow suddenly spikes. Prometheus can send an alert, letting you know there might be a problem with a specific pod or container. You can then investigate further using the details provided by the alert to identify the root cause, such as a memory leak or unexpected workload surge or develop a solution to automate self-healing.
How Does Grafana Help?
Grafana takes the data collected by Prometheus and turns it into informative dashboards. Think of it as a way to organize and visualize all that data so you can easily see what's happening. You can create custom dashboards that focus on the metrics that matter most to your applications and infrastructure. This allows you to quickly identify trends, anomalies, and potential problems.
Here are some additional benefits of using Grafana with Prometheus for Kubernetes observability:
Correlate Metrics: Grafana allows you to overlay data from different metrics on the same dashboard. This helps you see how different parts of your system are interacting and identify potential bottlenecks or cascading failures.
Annotate Dashboards: You can add notes and annotations to your dashboards to highlight events or incidents. This helps you understand the context behind changes in metrics and makes it easier to collaborate with other engineers when troubleshooting issues (https://grafana.com/docs/grafana/latest/dashboards/build-dashboards/annotate-visualizations/).
Shareable Dashboards: Grafana dashboards can be easily shared with other team members, allowing everyone to stay on the same page about the health of the Kubernetes cluster.
Use-Case: Create a dashboard that shows both pod restarts and container resource usage for one of the important service (Auth / User?!). This can help you see if pod crashes are happening because containers are running out of resources. You can then correlate this information with application logs to identify the specific code or process causing the resource drain.
Going Further: Advanced Techniques
Prometheus and Grafana are a powerful duo, but there's always more to learn. Here are a few ways to take your Kubernetes observability to the next level:
Advanced Alerting with PromQL: Prometheus's query language, PromQL, allows you to create sophisticated alerts based on complex relationships between multiple metrics. For example, you can set an alert to trigger only if CPU usage is high and coincides with a significant increase in request latency (PromQL documentation: https://prometheus.io/docs/prometheus/latest/querying/basics/).
Scaling Up with Thanos: If your cluster is large and generates a massive amount of metrics data, consider using Thanos to collect and store metrics across multiple servers. This helps distribute the load and ensures that your monitoring system remains performant (Thanos: https://github.com/thanos-io/thanos/blob/main/docs/getting-started.md).
Future-Proofing with OpenTelemetry: Explore OpenTelemetry, a vendor-neutral approach to collecting data. This can be helpful as you use different technologies in the future, as OpenTelemetry provides a standardized way to collect metrics, logs, and traces from any source (OTEL: https://opentelemetry.io/docs/)
Alerting Best Practices with Prometheus
Alerts are inevitable when it comes to being proactive. Prometheus' powerful alerting system allows you to define notifications based on specific metric thresholds, before anomalies create impact to customers. At the same time, bombarding SREs with a constant barrage of alerts (Noise) can be counterproductive. Here are some best practices to ensure your Prometheus alerts are actionable & effective:
Focus on Actionable Alerts: Not all deviations from normal are critical. Only set alerts for metrics that indicate a potential problem requiring intervention. Don't alert on informational metrics that simply reflect typical system behavior.
Define Clear Thresholds: Set alert thresholds based on historical data and the expected behavior of your system. Avoid overly sensitive thresholds that trigger on minor fluctuations. Conversely, overly permissive thresholds might miss critical issues. Analyze historical data to identify appropriate thresholds that balance sensitivity with avoiding alert fatigue.
Group Related Alerts: Sometimes, multiple metrics might spike together, indicating a single underlying issue. Group related alerts into a single notification to reduce alert fatigue and provide a clearer picture of the problem.
Silence Alerts Judiciously: The ability to silence alerts can be helpful during maintenance windows or when investigating known issues. However, overuse of silencing can mask critical problems. Use silences sparingly and for a limited duration.
Consider Alert Routing: Not all alerts require immediate attention from every SRE. Implement alert routing to send notifications to the most appropriate team member or channel based on the severity and nature of the alert.
Test Your Alerts: Don't wait for a real incident to discover malfunctioning alerts. Regularly test your alerts by injecting simulated metric changes to ensure they trigger appropriately.
By following these best practices, you can ensure your Prometheus alerts provide valuable insights and empower your SRE team to proactively address issues before they snowball into major outages.
Conclusion
Kubernetes offers unparalleled power and flexibility for deploying and scaling containerized applications. However, this complexity necessitates a robust observability strategy which is definitely a best practice to follow. Prometheus and Grafana, combined with effective alerting practices, provide a powerful open-source toolkit for SREs to navigate the dynamic seas of Kubernetes. By understanding key metrics, correlating data points, and implementing actionable alerts, you can ensure the smooth operation of your applications and deliver a flawless user experience. Remember, observability is a continuous journey. As your Kubernetes environment evolves, so too should your monitoring practices. Embrace new tools and techniques to stay ahead of the curve and maintain a deep understanding of your ever-changing digital landscape.
Connect with me on LinkedIn.
Stay curious, innovative, & keep pushing the boundaries of what's possible.
Catch you on the flip side!